Analysing hotspots using CrystalGazer and NDepend
Contents
When you start working on a new project, there are a couple of things that you should try to discover as fast as you can: the shape of the code and the internals of the team you’re working with.
You can (and should) try to discover both of them using conversations (at the end, developing software is having conversations (link in spanish)). But it’s also useful to try to discover this things for yourself, to confirm what the conversations are saying, or to bo a little bit faster.
There are a lot of tools out there to analyse your code. A very useful one is a static analysis tool like NDepend. With a tool like NDepend you can discover a lot of issues on your code, and you can even analyse the evolution of it using different snapshots.
But sometimes, you need another type of information. Discovering temporal couplings and hotspots is something you can discover with tools like CrytalGazer or CodeScene(https://codescene.io). In this article we’ll see how we can combine both type of tools.
Hotspots
A hotspot is a file that has high chances to need a refactor. We’re going to use three metrics to evaluate this:
- Number of commits performed that included the file
- Complexity of the file
- Number of people that contributed to the file
Let’s use CrystalGazer to gather this information. I’m going to use the ASP .Net MVC project to make this study. I’m doing this because Adam Tornhill has the same study using his tool Codescene and then I can compare the results :-).
Number of commits

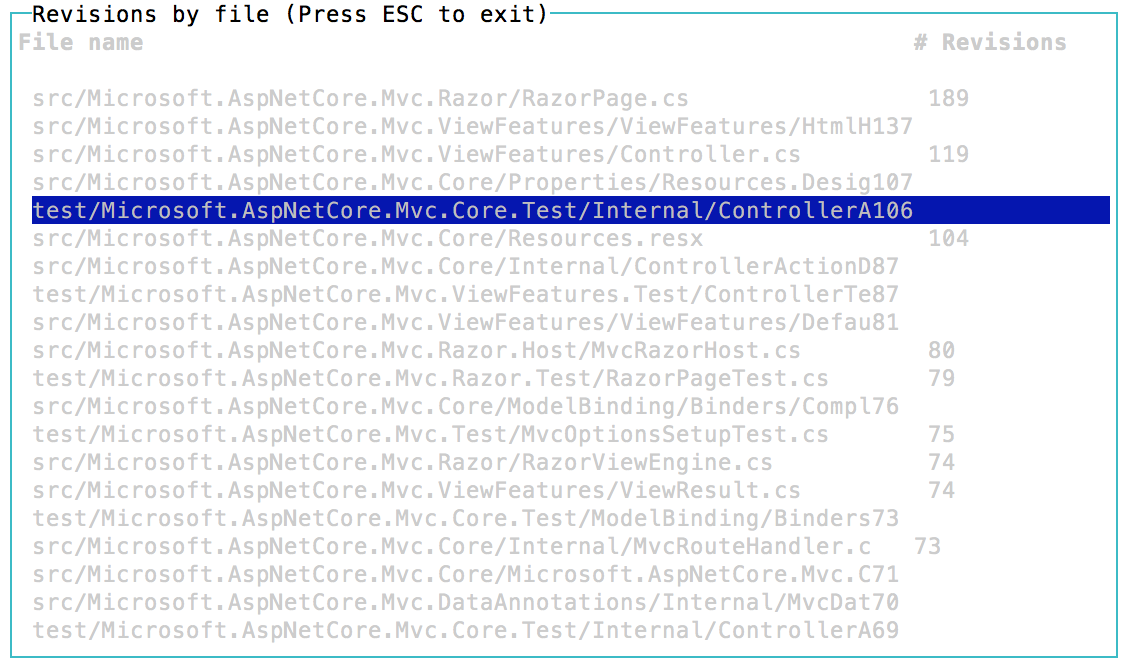
As you can see, there are six files with more than 100 revisions. One of them is a file called ControllerActionInvokerTests.cs, with 106 revisions.
Complexity

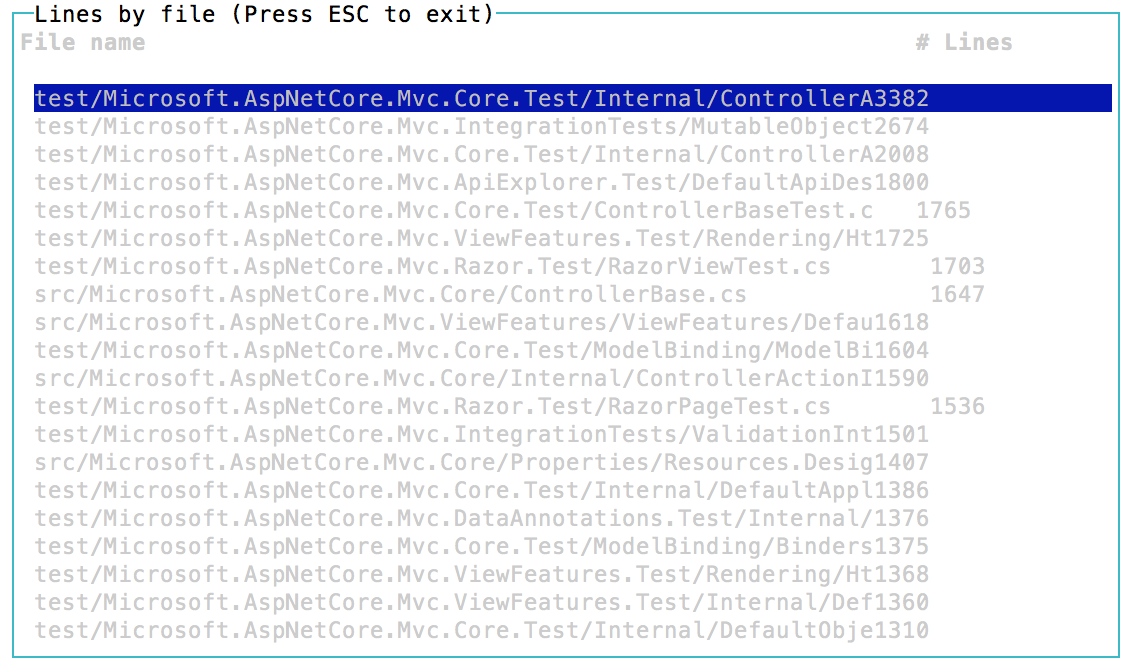
Here, we’re using a very simple metric to analyse complexity, as it is the number of lines. Number of lines is a good enough metric to perform this preliminary study and it’s easy an fast to calculate. You can use other metrics as number of tabs, cyclomatic complexity and so on.
In this case, our friend is the winner BY FAR.
Contributors

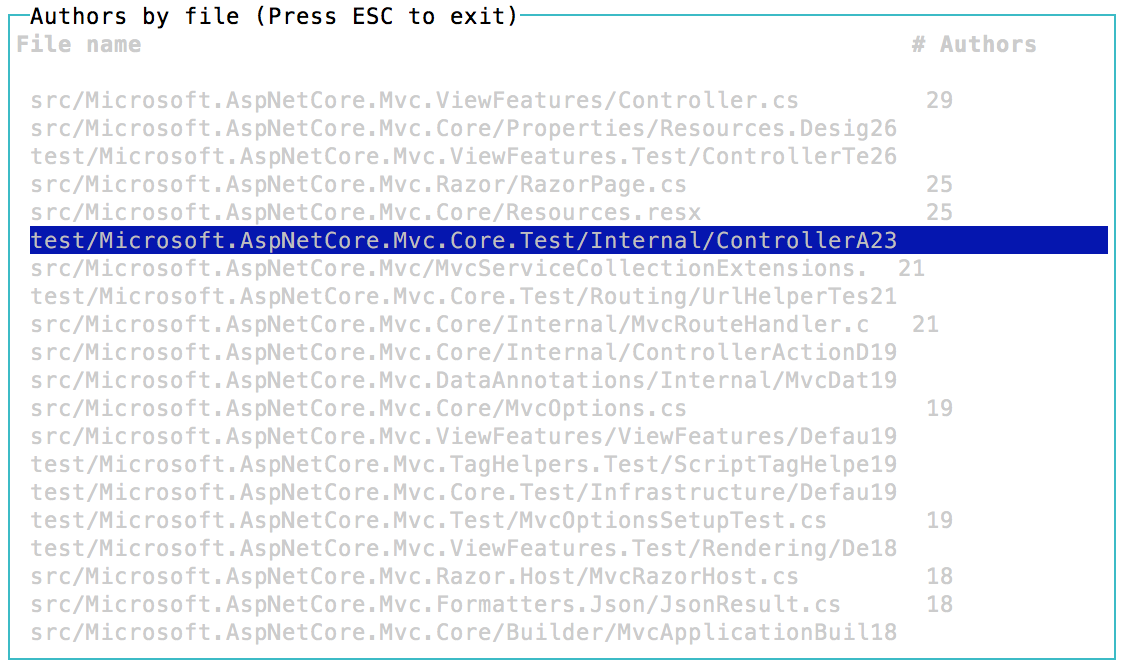
And finally, we’re going to take a look at the number of contributors. In this case, our friend is in a very honorable sixth position (fourth if we exclude the resource files).
So, it looks like we have a good candidate to study. Let’s take a look what NDepend says about it.
NDepend
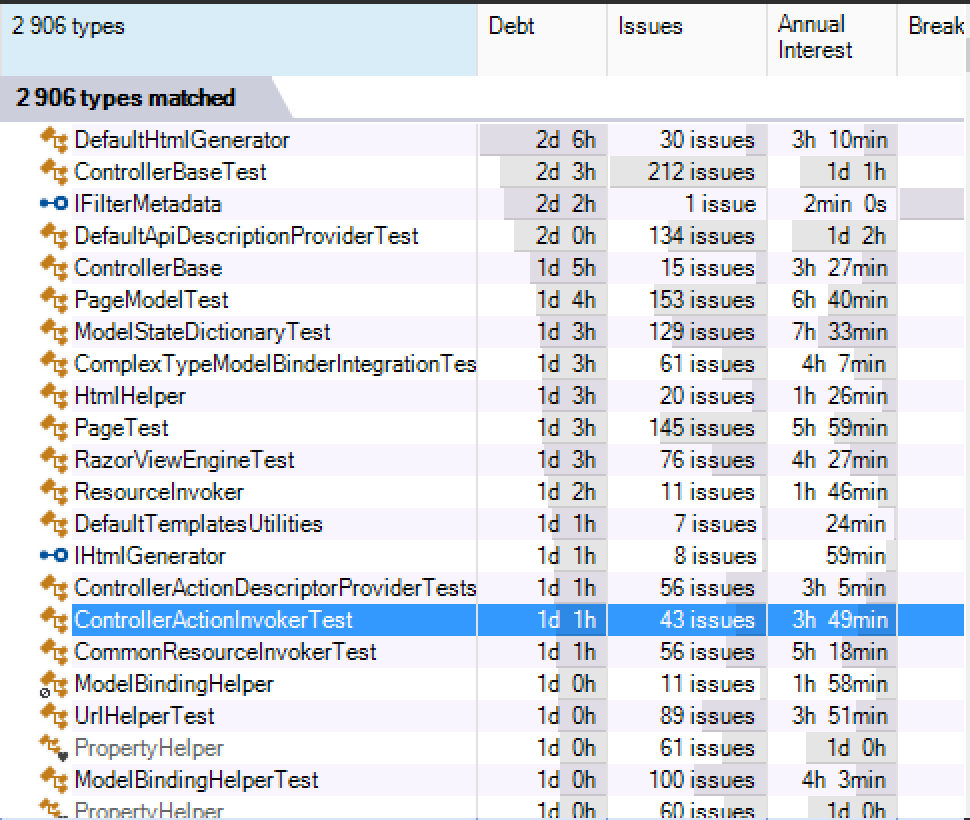
NDepend is an amazing tool with lots of options. In this case, I want to concentrate with the technical debt metric. According to NDepend, the project has a debt of 198.53 man-days and a rating of B, needing 90 man-days to reach a rating of A. So, I want to take a look at what are the worst classes to start working on them. NDepend will analyse my project in a very different way that we did before. It’s going to take a look at the internals of my code in the moment I run the analysis. So, let’s see what it says when I run the “Types Hot Spot” analysis of the debt.

Interestingly, our dear friend is also in a very “good” position in that list.
Summary
In this article we’ve taken an initial look at how to detect hotspots in our code with two very different tools: an static analysis tool like NDepend, and a repository analysis tool like CrystalGazer. We’ve seen that, in our case, the results are quite similar. This is something that shouldn’t necessarily happen.
We have different tools to analyse the state of our code. Let’s try to take advantage of all of them.
Author Vicenç García
LastMod 07-11-2017